![]()
ISSN 2379-5980 (online) DOI 10.5195/LEDGER.2025.393
RESEARCH ARTICLE
From Flows to Value: Cointegration Between Bitcoin Spot ETF Assets and Bitcoin Price
Taghi Guliyev,*† Aysu Ahmadova‡
Abstract. This study investigates the long-run relationship between the net assets of Bitcoin spot exchange-traded funds (ETFs) and Bitcoin’s price. Using daily data from 11 January 2024 to 16 May 2025, we employ cointegration techniques—Fully Modified OLS, Dynamic OLS, and Canonical Cointegrating Regression—to test for a stable equilibrium linking these series. The empirical results indicate a strong positive association in the long run: periods of expanding Bitcoin ETF assets correspond to higher Bitcoin price levels. Cointegration is confirmed at the 10% significance level, suggesting that the ETF assets under management and the Bitcoin market price move together in a persistent equilibrium. These findings support the hypothesis that ETF-driven demand exerts a lasting influence on Bitcoin’s valuation. By highlighting a structural connection between regulated Bitcoin investment vehicles and the underlying cryptocurrency, the study provides timely evidence of how financial innovation can shape asset pricing in the digital asset market.
![]()
* bc1qdy0uwtchhx0h6cpjqmqy395att33kpt2use3yp
† T. Guliyev (guliyev2@illinois.edu) is a graduate student of Finance at University of Illinois Urbana-Champaign, USA.
‡ A. Ahmadova (ahmadovaa@cardiff.ac.uk) is a graduate student at Cardiff University, UK.
![]()
Bitcoin, introduced in 2009, evolved from a fringe digital novelty into a mainstream asset. In its early years it faced fierce skepticism: Warren Buffett derided it as “probably rat poison squared,” and economist Nouriel Roubini called it the “mother of all bubbles.”1 Critics pointed to extreme volatility, speculative booms and busts (e.g., 2017) and the currency’s unclear intrinsic value. Over the following decade, however, Bitcoin gradually gained legitimacy. Supporters likened it to “digital gold,” and major companies and funds began taking notice. Fortune-500 firms started adding Bitcoin to their treasuries, and Wall Street began offering crypto services. Even previously skeptical figures shifted tone. By the early 2020s, leading asset managers began to embrace cryptocurrency, underscoring that Bitcoin was no longer viewed purely as a speculative toy but as an asset class of interest.
A turning point came with the quest for a U.S. spot Bitcoin exchange-traded fund (ETF). For years the SEC had blocked all such proposals, citing concerns over fraud and market manipulation. Between 2018 and 2023 the Commission formally “disapproved” over twenty spot-Bitcoin ETF filings. In mid-2023 this impasse began to thaw. On 15 June 2023, BlackRock—the world’s largest asset manager—filed for the first U.S. spot-Bitcoin ETF.2 The BlackRock filing was widely seen as a game-changer, lending Bitcoin unprecedented credibility. Within days, other financial giants followed suit: Fidelity (WisdomTree) filed for a “Wise Origin” Bitcoin Trust, Ark/21Shares refiled for their ARK21Shares ETF, and firms like Invesco and WisdomTree joined the queue. The stage was set for a historic regulatory decision. That decision arrived on 10 January 2024. In a watershed move, the SEC approved 11 spot Bitcoin ETFs—including BlackRock’s iShares Bitcoin Trust—after a decade-long struggle between regulators and the crypto industry. (This breakthrough followed a U.S. appeals court ruling that had vacated the SEC’s earlier denial of Grayscale’s Bitcoin-trust conversion, effectively forcing the agency to reconsider.) SEC officials took care to note that approval was not an endorsement of Bitcoin’s investment merits; nonetheless, the green light signified formal institutional acceptance of Bitcoin. Multiple spot ETFs began trading on U.S. exchanges on the following day. The new funds allow retail and institutional investors alike to gain Bitcoin exposure through familiar, regulated vehicles.
The initial market response was dramatic. On the first trading day (11 January 2024) U.S.-listed Bitcoin ETFs saw shares worth roughly $4.6 billion change hands—a surge reflecting pent-up demand. Bitcoin’s price climbed to about $46,000 by day’s end (its highest level in over two years). Issuers raced to attract assets, some temporarily slashing fees to capture market share. Over the first quarter of 2024, the 11 spot ETFs drew ~$12.1 billion in net inflows. BlackRock’s fund dominated this wave, amassing $13.9 billion of inflows, while the legacy Grayscale Bitcoin Trust saw roughly $14.7 billion of outflows as investors migrated to the new ETFs.3 The flood of ETF-driven capital coincided with a historic Bitcoin rally: by late March 2024, Bitcoin’s price had jumped about 67% year-to-date, briefly surpassing $73,000. In short, the ETF launch unleashed unprecedented institutional flows into Bitcoin and coincided with record-high prices for the cryptocurrency.
These developments raise important questions about flows and prices in the Bitcoin market. The spot Bitcoin ETFs created a new conduit for capital: do these ETF flows exert a lasting influence on Bitcoin’s value, or do price and flow movements simply reflect the same short-term factors? In traditional finance, fund inflows can both drive prices (through demand pressure) and respond to past returns (as investors chase winners). The Bitcoin ETF case may similarly have two-way dynamics: on one hand, large inflows into ETFs could feed upward pressure on Bitcoin’s price; on the other hand, investors may time ETF purchases based on prior Bitcoin gains. We address this by examining whether ETF net flows and Bitcoin’s price exhibit a stable long-run equilibrium (cointegration). If the two series are cointegrated, it implies a persistent, binding link—e.g., sustained ETF demand helping to “anchor” Bitcoin’s price. By contrast, a lack of cointegration would suggest that flows and price only move together episodically without a lasting tie.
Our study makes several contributions. To our knowledge, it is the first empirical analysis of long-run relations between cryptocurrency ETF fund flows and the underlying asset price. Prior work has explored cointegration in crypto (for example between spot and futures prices), but not the flows–price linkage.4 We exploit the 2024 ETF launch as a natural experiment: for the first time, substantial regulated fund flows poured into Bitcoin. Understanding whether these flows drive long-term price moves speaks to market efficiency and price discovery. If flows and price cointegrate, ETF demand appears to convey fundamental value and support Bitcoin’s market price; if not, it suggests ETF investors are simply chasing price trends. These findings will inform investors and policymakers about how traditional financial innovation (like ETFs) influences the cryptocurrency ecosystem.
The remainder of this paper is structured as follows. Section 2 reviews relevant literature and provides background on Bitcoin ETFs and cointegration in asset markets. Section 3 describes the data and methodology, including the statistical tests for cointegration and related econometric techniques. Section 4 presents the empirical results of our cointegration analysis between ETF flows and Bitcoin returns, and discusses the robustness of the findings. Section 5 concludes the paper with final remarks and suggestions for future research.
The landscape for spot Bitcoin exchange-traded funds (ETFs) has evolved rapidly since 2020. After years of regulatory hurdles, a watershed moment came in early 2024 when U.S. regulators approved a wave of spot Bitcoin ETFs.5 On 10 January 2024, the SEC greenlit the listing of multiple spot Bitcoin ETPs (including BlackRock’s and Fidelity’s), marking the first time U.S. investors could directly buy a Bitcoin-backed ETF on domestic exchanges.6 This followed a decade of rejected applications due to concerns over market manipulation and custody risks.7 The U.S. launch echoed earlier international developments: Canada pioneered the first spot Bitcoin ETF in February 2021 (Purpose Bitcoin ETF, BTCC), which amassed $1 billion AUM in its first month,13 underscoring pent-up investor demand for convenient Bitcoin exposure. By contrast, the U.S. initially only permitted futures-based Bitcoin ETFs (starting with ProShares BITO in October 2021), which introduced additional complexity (e.g., contract roll costs).8 The advent of U.S. spot ETFs in 2024 dramatically lowered these frictions, allowing funds to hold physical Bitcoin and enabling direct creation/redemption in the underlying asset.
Investor reception of spot Bitcoin ETFs has been enthusiastic. On the first trading day of U.S. launches (11 January 2024), investors traded over $4.7 billion into the newly listed funds.9 Cumulative net inflows reached nearly $10 billion within two months, with BlackRock’s iShares Bitcoin Trust (IBIT) alone attracting about $10 billion and Fidelity’s fund $6.2 billion.10 These blockbuster flows instantly made Bitcoin ETFs a significant segment of the ETF market, averaging roughly 2.8% of total U.S. ETF trading volume in early 2024.10 Notably, the surge of inflows did not cause an immediate price spike in Bitcoin itself—on launch day, Bitcoin’s price remained around $46,500 (little changed), and the newly minted ETFs actually traded down a few percent.11 This suggests that the ETF approvals were largely anticipated and arbitraged into the market ahead of time, resulting in high initial trading volumes but muted price impact. Nonetheless, over the longer term, the introduction of spot ETFs is expected to broaden investor access, deepen market liquidity, and potentially stabilize prices. Early empirical evidence supports a stabilization effect: one study found that after the approval of U.S. spot Bitcoin ETFs, volatility in several major cryptocurrencies (Ethereum, XRP, Litecoin) significantly decreased, consistent with improved market depth and price discovery.12 For Bitcoin’s own market, the same study observed no immediate change in spot price volatility, indicating that Bitcoin’s vast size and existing liquidity may have absorbed the new ETF flows without disruption.12 Overall, the post-2020 emergence of spot Bitcoin ETFs—from Canada and Europe to the recent U.S. debut—represents a milestone in crypto market maturation. These products are carefully designed (with robust custody and transparency measures) to satisfy regulators, and they cater to investor behavior by offering easy exposure (e.g., through brokerage accounts) without the complexities of wallets or direct crypto trading.13 Going forward, their market impact is a subject of active study, particularly whether sustained fund inflows translate into long-run price pressures on Bitcoin—a question our cointegration analysis directly addresses.
A rich body of literature in finance examines how ETF fund flows can influence underlying asset prices and market liquidity. In theory, under efficient markets, the act of creating or redeeming ETF shares (via the in-kind arbitrage mechanism) should not materially affect fundamental values. In practice, however, large ETF flows often act as non-fundamental demand shocks that can push underlying prices away from fundamentals, at least in the short run.14 When investors pour money into an ETF, authorized participants must buy the underlying assets to create new shares, which can drive those asset prices up (and vice versa for outflows). Empirical evidence confirms price-pressure effects. For example, stocks with high passive ETF ownership exhibit significantly higher volatility than otherwise similar stocks, suggesting that ETF-related arbitrage trading adds an extra layer of demand fluctuations. Ben-David et al. document that a one standard deviation increase in ETF ownership is associated with a 16% rise in daily stock price volatility, driven by arbitrage activity between the ETF and its components.15 Similarly, Zou finds that surging ETF inflows can induce stock misvaluation, with high-flow stocks becoming overvalued and subsequently underperforming as prices mean-revert.14 These findings support the “price pressure” hypothesis over the “smart money” hypothesis for passive fund flows, i.e., flows move prices more than they convey superior information.
On the other hand, ETFs can also enhance market liquidity and price discovery, especially in otherwise illiquid markets. Research from the bond market during stressed conditions (e.g., the March 2020 turmoil) showed bond ETFs providing continuous price quotes when the underlying bonds went dark, thereby facilitating price discovery and liquidity transfer.16 In the context of Bitcoin, which trades 24/7 globally, the introduction of ETFs creates an additional venue for price discovery. So far, evidence suggests that price discovery remains dominated by the spot Bitcoin markets rather than the ETF. A recent study applying high-frequency metrics between Bitcoin spot exchanges and newly listed Bitcoin ETPs found that spot markets lead ETFs in incorporating information.17 This is intuitive given Bitcoin’s enormous global trading volume relative to the initial size of any single ETF. Nevertheless, ETF flows provide a new channel of demand that could impact Bitcoin’s price over longer horizons. A useful analogy is with gold: the advent of gold ETFs in the mid-2000s made gold accessible to a broad investor base, and gold ETF holdings grew in tandem with rising gold prices. Indeed, studies have documented a positive relationship between gold ETF flows/holdings and the price of gold, suggesting that ETFs helped funnel investment demand into the underlying metal.18 By shifting part of the investor base from physical or futures markets into ETFs, these instruments can concentrate and amplify investor sentiment. In Bitcoin’s case, spot ETFs may similarly concentrate retail and institutional demand via fund flows. Whether these flows and Bitcoin’s price are tightly linked in the long run is an open question—one that cointegration testing can shed light on.
Importantly, the flow–price nexus is also linked to liquidity provision. As ETFs experience inflows, the creation process can improve liquidity in the underlying (market makers arbitrage away price discrepancies). Conversely, outflows can force “fire sales” of underlying assets if arbitrageurs face frictions, potentially amplifying volatility. The Bitcoin market is highly liquid relative to the scale of early ETF flows, but sustained large inflows or outflows could still exert measurable long-run pressure. This dynamic has been observed with commodity ETFs; for instance, a BIS analysis noted that when oil-tracking ETFs faced large outflows and had to roll or liquidate futures positions, it contributed to downward pressure on oil prices.8 Therefore, understanding the interplay of ETF flows and asset prices is crucial. In our context, if Bitcoin ETF net flows contain persistent demand information, we may expect cointegration between cumulative flows and Bitcoin’s price, reflecting a long-run equilibrium where capital entering the Bitcoin market via ETFs aligns with higher fundamental valuation of Bitcoin. Conversely, if flows are mostly reactive or short-term, no such stable relationship would exist. Prior studies on fund flows and performance in traditional markets help frame these hypotheses, but the Bitcoin ETF is a novel arena to test them.19
The question of whether Bitcoin behaves like a traditional risk asset or a “safe-haven” asset has been widely explored, as it directly informs investor motivations for using Bitcoin ETFs (e.g., for diversification or hedging). Early research often highlighted Bitcoin’s low correlation with stocks and bonds, pointing to diversification benefits and even safe-haven potential during market stress (analogous to gold).20, 21 For instance, Bouri et al. found that Bitcoin could serve as a weak safe haven for small equity market downturns, albeit not for extreme crashes.22 However, recent evidence suggests Bitcoin’s correlation structure changed post-2020. During the COVID-19 pandemic and the subsequent policy responses, Bitcoin became more tightly coupled with equities and other risk assets. One study found a structural break around March 2020 after which Bitcoin’s correlations with stock indices rose significantly, thereby reducing its diversification benefit in portfolios.23 In fact, by 2021–2022 Bitcoin often traded “like a high-beta tech stock,” with 30-day correlations with the S&P 500 frequently exceeding 0.5–0.7 during volatile periods.24 This risk-on behavior was evident during the March 2020 liquidity crunch, when Bitcoin sold off sharply alongside equities, undermining the safe-haven narrative. On the other hand, the nature of Bitcoin’s relationship with traditional assets can be regime-dependent. Some research identifies episodes where Bitcoin decouples from equities during specific geopolitical or macroeconomic shocks. For example, a recent analysis focusing on geopolitical risk (e.g., during certain conflict events) found that Bitcoin, like the Swiss franc, acted as a strong safe haven against global equity crashes triggered by geopolitical turmoil.25 This contrasts with gold and U.S. Treasuries, which in that study did not hedge equity losses in those particular scenarios.25 Such findings highlight Bitcoin’s dual character: in benign times or speculative rallies, it trades as a risk-on asset correlated with growth stocks, but in certain crisis or inflationary episodes, it is touted (and occasionally behaves) as “digital gold.” Indeed, Bitcoin’s fixed supply and decentralized nature have led some to argue it is an inflation hedge. Empirical support for this is mixed; one study found that Bitcoin does appreciate in response to inflation surprises, consistent with an inflation-hedging role, yet the same study reiterated that Bitcoin is not a reliable safe haven during stock market crashes.20 Overall, there is no academic consensus on Bitcoin as a safe haven.
For our purposes, this debate implies that investors use Bitcoin ETFs for different objectives—some for pure speculative exposure, others for diversification or hedge motives. If Bitcoin were truly a safe haven or hedge akin to gold, we might expect sustained inflows during times of equity market stress, potentially establishing a long-run relationship between those flows and Bitcoin’s price (as investors buy Bitcoin for its hedging properties). Conversely, if Bitcoin is mostly a risk asset, flows may chase performance and risk sentiment, which could lead to more transient relationships. Notably, recent market behavior in early 2025 showed that during stock market volatility and crypto downturns, investors rotated into gold ETFs far more than Bitcoin ETFs, reaffirming gold’s status as a preferred safe asset.26 Bitcoin ETF flows in such periods have been modest, suggesting many investors still view Bitcoin as risk-exposure rather than a protective allocation. These patterns will inform the interpretation of our cointegration tests: a cointegrating relationship between Bitcoin ETF flows and Bitcoin returns might reflect an underlying long-run demand trend (possibly related to Bitcoin’s adoption or macro-hedging appeal), whereas an absence of cointegration would be consistent with flows being largely reactionary to short-term price swings in a risk-on paradigm.
Comparing Bitcoin ETFs with gold ETFs provides useful context, given that Bitcoin is often dubbed “digital gold.” Gold ETFs (such as SPDR Gold Shares, GLD) have been in existence since 2004 and are a well-studied case of how introducing an ETF for a commodity can affect the market. Gold ETFs dramatically lowered the barriers to owning gold, triggering substantial inflows especially in times of economic uncertainty. Research finds that the availability of gold ETFs shifted some price discovery to the ETF market and increased the responsiveness of gold prices to investment demand.18 During the 2008 financial crisis and other stress events, gold ETFs saw large inflows as investors sought safety, contributing to gold price rallies. Crucially, gold’s role as an inflation hedge and safe haven is well established in literature.27 Bitcoin ETFs differ in key respects: Bitcoin’s volatility is an order of magnitude higher than gold’s, and its risk/return profile is more akin to a speculative asset. This means Bitcoin ETFs inherit a much more volatile underlying, which in turn affects their suitability as hedging tools. For example, a recent study finds that cryptocurrencies (Bitcoin and others) currently do not offer a reliable alternative to gold for hedging inflation risk, reinforcing that gold remains the go-to hedge for investors concerned about macro stability.26 From a volatility perspective, Bitcoin’s annualized volatility often exceeds 60–80%, whereas gold typically ranges in the teens. As a result, Bitcoin ETFs are used more for return enhancement than volatility reduction in portfolios, whereas gold ETFs are a classic safe-haven allocation.
The contrast was evident during the market volatility of late 2024–early 2025: investors favored gold ETFs over Bitcoin ETFs as stock markets wavered, leading to net inflows in gold funds while Bitcoin funds saw tepid demand or outflows.28 This behavior underscores gold’s enduring credibility as a defensive asset. Nonetheless, Bitcoin ETFs have shown some hedging potential in niche cases—for instance, during certain emerging market currency crises or periods of dollar weakness, Bitcoin prices (and by extension Bitcoin ETFs) provided diversification when gold was trading flat. Also, like gold, Bitcoin has no cash flows and is often valued as a store of value; thus, both gold and Bitcoin prices are driven heavily by investor sentiment and demand for safe assets. This parallel suggests that sustained inflows into Bitcoin ETFs could have analogous effects to gold ETF inflows, i.e., putting upward pressure on the underlying asset’s price and potentially establishing a long-run equilibrium relationship. However, any such relationship for Bitcoin is likely more volatile and may be regime-specific. In terms of cointegration, one might recall that gold ETF holdings and gold prices should move together in the long run (since the ETF is backed by physical gold—indeed, arbitrage keeps them tightly linked). In Bitcoin’s case, a spot ETF is similarly backed by physical Bitcoin; hence, if the ETF grows (higher net flows, higher AUM), it directly implies more Bitcoin being held in custody on behalf of investors. This could forge a long-run tie between the size of ETF holdings and the market price of Bitcoin, assuming investor demand via ETFs is a meaningful component of overall demand. Our research effectively tests for this via net flows (which accumulate to changes in ETF holdings) and Bitcoin returns (which accumulate to price changes).
Additionally, we compare our findings to analogous cases (e.g., gold): prior studies indicate that gold ETF demand had a lasting impact on gold’s price level, though gold’s lower volatility made the effect smoother. With Bitcoin, the jury is still out—our study aims to fill that gap by rigorously examining the long-run co-movement (if any) between Bitcoin ETF flows and prices. Finally, regarding volatility, it is worth noting that some analysts have argued that spot Bitcoin ETFs might ultimately dampen Bitcoin’s volatility by pooling liquidity and improving access. In the long run, easier access through ETFs could broaden the investor base and reduce idiosyncratic swings (analogous to how futures trading and ETFs have gradually tamed some volatility in gold).12 Early data post-ETF-launch hint at this: Bitcoin’s 30-day volatility did not spike despite billions in flows, and other crypto assets even saw volatility declines.12 This contrasts with the launch of Bitcoin futures-based ETFs, where some feared volatility amplification due to complex dynamics.8 The difference reinforces that a physically-backed ETF integrates more directly with the spot market. Therefore, comparing Bitcoin and gold ETFs yields an important insight: both represent a conduit for investor sentiment into an asset with constrained supply, and in both cases we might expect a long-run equilibrium between fund demand and price, tempered by the asset’s volatility and haven status. Our study’s focus on cointegration between Bitcoin ETF flows and Bitcoin returns will explicitly test whether such an equilibrium relationship has begun to manifest in the crypto space, much as it arguably has in the gold market.
Given the trending behavior of crypto assets, researchers have increasingly applied cointegration analysis to investigate long-run relationships in cryptocurrency markets. Cointegration techniques test whether non-stationary time series share a common stochastic trend—in other words, whether a linear combination of, say, Bitcoin’s price and another variable is stable over time. If so, the series move together in the long run despite short-run deviations. In our context, the hypothesis is that Bitcoin ETF net flows (cumulative flows) and Bitcoin’s price/return may be cointegrated, indicating a stable long-run linkage such as an equilibrium between fund demand and market valuation. To analyze this, we draw on advanced econometric methods that have been recommended for cryptocurrency time series. In particular, we employ Fully Modified OLS (FMOLS), Dynamic OLS (DOLS), and Canonical Cointegrating Regression (CCR)—three techniques that provide robust estimates of cointegrating relationships. These methods correct for issues like serial correlation and endogeneity that can bias standard OLS estimates of cointegrating vectors.29 For example, FMOLS applies a semi-parametric adjustment to remove long-run correlations in the errors; DOLS includes lead-lag differenced terms to soak up short-run dynamics; and CCR filters the data to achieve asymptotically efficient estimates.29, 30, 31, 32 By using FMOLS/DOLS/CCR, researchers can obtain more reliable long-run coefficients even with relatively short or volatile samples—a pertinent consideration given Bitcoin’s history.
Several studies have utilized these methods in crypto finance research. For instance, Ahmadova et al. examine the long-run association between Bitcoin’s price and macro-financial variables (NASDAQ index, U.S. dollar index, gold, oil) using FMOLS, DOLS, and CCR.29 They find evidence of cointegration between Bitcoin and some traditional assets: their FMOLS/DOLS results suggest Bitcoin has a statistically significant long-run relationship with equity and currency markets (positive with NASDAQ, negative with the dollar), though interestingly not with gold in that study.29 This indicates Bitcoin’s price trend has become linked to broader financial conditions, a sign of integration with traditional markets. Other work has explored cointegration among cryptocurrencies themselves—e.g., whether Bitcoin, Ethereum, and other major coins share a common trend. Results there are mixed: some authors report no cointegration (implying each crypto follows its own path), while others find that certain coins do move together in the long run, especially during periods of market maturation or when a common factor (like global crypto adoption) drives them. 33 Methodologically, the FMOLS/DOLS approaches have been praised for handling the extreme volatility and potential structural breaks in crypto data better than simple Engle-Granger two-step regressions. Researchers also often complement cointegration tests with vector error-correction models (VECM) to capture short-run adjustments to the long-run equilibrium once a cointegrating relationship is established.34
In applying these methods to Bitcoin ETF flows and returns, we align with prior studies that looked at relationships between crypto and other economic variables. For example, Akbulaev and Abdulhasanov analyzed the connection between Bitcoin prices and energy prices during the pandemic, employing FMOLS and DOLS on weekly data.35 Their findings showed very small long-run elasticity between oil prices and Bitcoin (a 1% increase in oil price was associated with only ~0.00018% increase in Bitcoin price by FMOLS, a tiny effect) and results were not consistent across estimation methods. This underscores that detecting cointegration in crypto markets can be challenging; the relationships might be weak or masked by short-run volatility. It also highlights the importance of using multiple estimators (FMOLS, DOLS, CCR) for robustness. In our study, we will similarly check that any cointegration between ETF flows and Bitcoin returns is robust across techniques and not an artifact of any one method.
Finally, it is worth noting that cointegration analysis in crypto has also been used to test market efficiency and arbitrage. For instance, some have tested for cointegration between Bitcoin futures and spot prices, or between prices on different exchanges, to see if deviations are mean-reverting (a sign of an efficient market). The extension of such analysis to fund flows vs. returns is novel. If we find cointegration, it would imply that Bitcoin ETF net flows contain a persistent component that moves in tandem with Bitcoin’s long-run price path. Economically, this could be interpreted as ETFs capturing a secular adoption or investment demand trend that supports Bitcoin’s value. If we do not find cointegration, it suggests that flows are mostly short-term and do not leave a lasting imprint on Bitcoin’s price level. In summary, the econometric toolkit of FMOLS, DOLS, and CCR—validated in prior cryptocurrency research—provides a rigorous way to evaluate the core research question: do spot Bitcoin ETF flows and Bitcoin prices exhibit a stable long-run equilibrium relationship?29 Our literature review underscores the relevance of this question. The interplay of ETF flows and asset prices is well-studied in traditional finance (with documented effects on valuation and volatility), and Bitcoin’s evolving role in portfolios suggests its price is influenced by cross-market demand and sentiment. By examining cointegration, we bridge these insights to determine whether the advent of Bitcoin ETFs has tethered Bitcoin’s price to the gravitational pull of fund flows, or if, conversely, Bitcoin remains a law unto itself in the long run.
3.1. Data—We utilize daily time-series data spanning from 11 January 2024 to 16 May 2025, totaling 352 observations (trading days). The analysis focuses on two key variables: the price of Bitcoin and the aggregate assets under management in spot Bitcoin ETFs. For consistency and econometric suitability, both series are transformed into natural logarithms, denoted as LBTC (log Bitcoin price in USD) and LTNF (log total net assets of spot Bitcoin ETFs in USD). This period begins with the launch of multiple spot Bitcoin ETFs; notably, on the very first trading day of these ETFs (11 January 2024), their combined net assets were already on the order of $50 billion (as reported by CoinGlass’s Bitcoin ETF tracker). Such a large initial AUM reflects substantial early investor demand. The Bitcoin price over our sample starts around $40,000 and rises dramatically to over $100,000, indicating a strong upward trend that coincides with the introduction and growth of the ETFs. By taking logarithms of price and ETF assets, we mitigate heteroskedasticity and can interpret subsequent cointegration coefficients as elasticities, which is appropriate given the exponential growth behavior observed in crypto-asset markets.
Table 1. Definition of variables. |
|
Type |
Variable name |
Definition/Measurement |
Source of data |
|
Dependent |
Bitcoin (BTC) |
BTC/USD bitfinex historical daily close price |
https://www.investing.com/crypto/bitcoin/btc-usd-historical-data |
|
Independent |
Total Net Assets (T_TNF) |
The total net assets of Bitcoin ETFs |
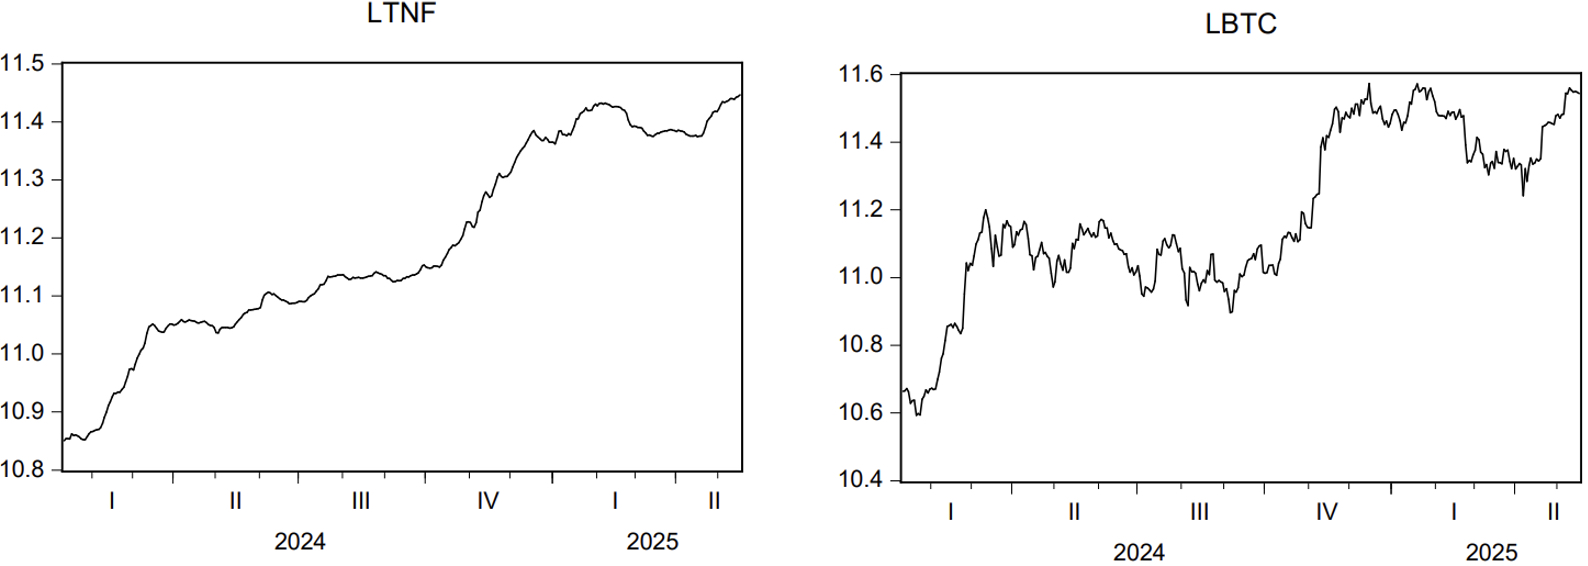
Fig. 1. Logarithmic graphs of variables. |
3.2. Descriptive Statistics—The summary statistics of the Bitcoin price and total ETF net assets highlight both the growth and volatility of these series over the sample. Bitcoin’s price (BTC) averaged about $73,987, with a median of $68,050. The price ranged from a low of roughly $39,868 (recorded near the start of the period) to a peak of $106,187, and had a standard deviation of $17,554.90. This wide range and large standard deviation underscore Bitcoin’s notorious volatility: the asset more than doubled from trough to peak within 16 months. The total net assets of spot Bitcoin ETFs (T_TNF, denoted in USD millions) show a similarly strong growth trajectory. T_TNF averaged approximately $73,409 million (i.e., $73.41 billion) with a median of $68,609 million. Total ETF assets under management grew from a minimum of $51,557 million (on launch day) to a maximum of $93,550 million by the end of our sample. The standard deviation of ETF AUM (~$12,506 million) is sizeable, though in relative terms the variability in ETF assets was slightly lower than that of Bitcoin’s price. This is intuitive, as ETF AUM changes reflect both price changes in the underlying Bitcoin held and capital flows (investor purchases and redemptions of ETF shares).
Table 2. Descriptive statistics of variables. |
|
Descriptive Metrics |
BTC |
T_TNF |
|
Mean |
73987.82 |
73409.86 |
|
Median |
68050.00 |
68609.90 |
|
Maximum |
106187.00 |
93550.30 |
|
Minimum |
39868.00 |
51557.00 |
|
SD |
17554.91 |
12506.52 |
|
Observations |
352 |
352 |
|
T_TNF: Total Net Assets of SpotBitcoin ETFs (denoted in millions of USD) | ||
Several economic insights emerge from these figures. First, the fact that the mean exceeds the median for both BTC price and ETF assets suggests a right-skewed distribution driven by the late-sample surge in Bitcoin’s value and corresponding fund inflows. In other words, the latter part of the sample (as Bitcoin rallied to new highs) pulled the averages up. The nearly doubling of Bitcoin’s price over the sample is mirrored by a substantial expansion in ETF holdings—from about $50 billion to over $93 billion—indicating that investors poured new money into spot Bitcoin ETFs as the cryptocurrency’s price climbed, and the existing holdings also appreciated in value. This co-movement is quantitatively reflected in a very high correlation between the log-transformed series: the correlation coefficient between LBTC and LTNF is 0.9248. Such a strong positive correlation implies that the two variables moved in tandem, consistent with the notion that Bitcoin’s market rally and the growth of ETF investments went hand-in-hand. Of course, a high correlation alone does not confirm a stable equilibrium relationship—it could arise from a common upward trend—but it does suggest that the ETF asset base and Bitcoin price may be closely linked. This observation motivates a formal cointegration analysis to determine whether a long-run equilibrium relationship exists between the two (as opposed to a spurious correlation driven by shared time trends).
3.3. Methodology—Our methodological approach is rooted in time-series cointegration analysis, appropriate for examining the long-run relationship between Bitcoin price and ETF assets. We begin by examining the stationarity properties of each series. Standard unit root tests (e.g., Augmented Dickey-Fuller) indicate that both the Bitcoin price and the total ETF AUM are non-stationary in levels but become stationary after first-differencing—in other words, each series is integrated of order one, I(1). Given two I(1) variables, a linear combination might be stationary if the variables are cointegrated. We therefore test for cointegration between LBTC and LTNF. In practice, this involves techniques like the Engle-Granger two-step procedure and Johansen’s trace test to check whether a statistically significant cointegrating relationship exists. These tests confirm that LBTC and LTNF do indeed share a common stochastic trend, i.e., there is evidence of a cointegrating vector binding Bitcoin’s price and ETF net assets in the long run.
Having established cointegration, we proceed to estimate the long-run cointegrating equation (with LTNF as the dependent variable and LBTC as the explanatory variable, or vice versa) using three different estimators for robustness: Fully Modified OLS (FMOLS), Dynamic OLS (DOLS), and Canonical Cointegrating Regression (CCR). Each of these single-equation estimators is designed to yield consistent and efficient estimates of cointegrating coefficients by addressing the pitfalls of standard OLS in the presence of unit roots.
Table 3. Unit root tests. |
|
|
Variable |
The ADF Test |
The PP Test |
||
|
Level |
First Difference |
Level |
First Difference |
||
|
Intercept |
Lbtc |
-1.684987 |
-18.72309*** |
-1.665710 |
-18.73773*** |
|
Ltnf |
-1.321013 |
-9.995567*** |
-1.422814 |
-9.902472*** |
|
|
Trend and Intercept |
Lbtc |
-2.264034 |
-18.70891*** |
-2.252299 |
-18.72442*** |
|
Ltnf |
-1.810540 |
-10.03123*** |
-1.760060 |
-10.01631*** |
|
|
| |||||
FMOLS, originally developed by Phillips and Hansen, modifies the ordinary least squares estimator to account for serial correlation in the residuals and for the endogeneity of regressors that arises from the cointegrating relationship.36 In essence, FMOLS applies a non-parametric correction so that the resulting coefficient estimates have well-behaved asymptotic properties (i.e., unbiased and normally distributed for inference) despite the joint non-stationarity of the variables. Similarly, the CCR method of Park uses a transformation of the data (filtering out long-run dependence) as a nonparametric correction to OLS, achieving the same goals of bias-correction and improved inference.32, 37 Stock and Watson’s DOLS estimator takes a slightly different approach: it augments the cointegrating regression with lead and lag terms of the first-differenced variables (ΔLBTC and ΔLTNF) to absorb short-run dynamics and any feedback effects.31 This augmentation effectively eliminates residual serial correlation and endogeneity, yielding an estimator that is asymptotically equivalent to the Johansen maximum-likelihood estimator for cointegration.31 By including sufficient leads/lags of differences, DOLS produces super-consistent estimates of the long-run parameters and allows standard t-tests on those coefficients.
We choose these three estimators over alternative frameworks (such as Johansen’s full-system VECM approach or the ARDL bounds testing approach) for their suitability in a bivariate cointegration setting and their robust small-sample performance. Johansen’s method, while powerful for multivariate systems, requires estimating a vector autoregression with multiple lags and determining the rank of cointegration; in a two-variable scenario, this can needlessly consume degrees of freedom and is sensitive to model specification (e.g., trend assumptions and lag length). In contrast, FMOLS/DOLS/CCR focus directly on the single long-run equation of interest, providing a parsimonious estimation that is well-suited to our limited sample size. These single-equation methods correct for endogeneity and serial correlation by construction, which means we do not have to incorporate a large number of lags as in an ARDL model to capture short-run dynamics. The ARDL approach (Pesaran-Shin bounds testing) is indeed flexible for mixed-order integration, but here both series are clearly I(1) and cointegrated, so the specialized cointegration estimators can be expected to yield more efficient long-run estimates without the complexity of model selection for lags. Moreover, the FMOLS, DOLS, and CCR estimators all produce asymptotically unbiased, efficient estimates of the cointegrating vector and allow valid hypothesis testing using standard normal critical values. By using all three in parallel, we can check the robustness of our findings: if the estimated long-run elasticity between Bitcoin price and ETF assets is similar across FMOLS, DOLS, and CCR, it increases confidence in the validity of the cointegrating relationship. In summary, our methodology emphasizes rigorous treatment of non-stationary data—testing for unit roots and cointegration—and employs advanced cointegration estimators to obtain reliable estimates of the long-run equilibrium relationship between Bitcoin’s market price and the scale of Bitcoin ETF holdings. This approach is appropriate for a finance context where both economic theory and statistical properties suggest a tight linkage between the two time series, and it ensures that any inference about their relationship is grounded in sound econometric technique rather than spurious correlations.
4.1. Unit Root Tests—We begin by examining the integration properties of the two series: the natural log of Bitcoin price (LBTC) and the natural log of total net assets of spot Bitcoin ETFs (LTNF). Augmented Dickey-Fuller (ADF) and Phillips-Perron (PP) tests are applied to each series in both levels and first differences, under both intercept-only and intercept-plus-trend specifications.38, 39 The unit root test results consistently indicate that both LBTC and LTNF are non-stationary in levels but become stationary after first differencing. In other words, each series contains a unit root and is integrated of order one. For example, the ADF test statistic for LBTC in levels (with only an intercept) is around -1.7 (p ≈ 0.44) and with a linear trend is about -2.3 (p ≈ 0.45), both of which are above the 5% critical values (approximately -2.87 and -3.42 respectively), thus failing to reject the null hypothesis of non-stationarity. By contrast, in the first-differenced data, the ADF statistics plummet (e.g., roughly -18.7 for ∆LBTC with trend), easily exceeding critical values and yielding p-values < 0.01, which confirms that the differenced series are stationary. The PP tests yield analogous outcomes in both levels and differences, reinforcing the conclusion that LBTC and LTNF are I(1) variables.
In summary, all unit root tests (ADF and PP alike) confirm that LBTC and LTNF are each integrated of order one. This finding satisfies the precondition for a valid cointegration analysis—namely, that the variables be of the same order of integration—and thus justifies proceeding to test for a long-run equilibrium relationship between the two series. Accordingly, we next investigate whether LBTC and LTNF are cointegrated, employing robust estimators (FMOLS, DOLS, and CCR) appropriate for I(1) variables.
4.2. Estimation Outputs—Having established that both series are I(1), we test for cointegration between LBTC and LTNF. We employ the Engle–Granger two-step procedure and the Phillips–Ouliaris residual-based tests to assess whether a stable long-run relationship exists (Table 4) 40, 41 Both tests provide evidence rejecting the null hypothesis of no cointegration, albeit at the 10% significance level. In particular, the test statistics from both Engle–Granger and Phillips–Ouliaris approaches indicate significance at the 0.10 threshold (but not at 0.05). This relatively weak level of significance likely reflects the limited sample horizon of the data, which spans just over one year of observations, which is a short period for capturing long-run relationships. Nonetheless, given that both cointegration tests consistently point to the existence of an equilibrium relationship (even if marginally significant), we proceed under the assumption that LBTC and LTNF are indeed cointegrated. This approach is further justified by evidence from other recent analyses that suggest the emergence of a stable long-run linkage between Bitcoin ETFs and spot prices.42 We thus find it reasonable to posit a cointegrating relationship between Bitcoin’s price and the scale of ETF investment, and we move on to interpret the estimated long-run coefficients of that relationship.
Table 4. Cointegration test results: Engle–Granger and Phillips–Ouliaris. |
|
|
Engle-Granger Test |
Phillips-Ouliaris Test |
||
|
Dependent |
Tau-Statistic |
Z-Statistic |
Tau-Statistic |
Z-Statistic |
|
FMOLS / DOLS / CCR |
-3.105346* |
-18.50779* |
-3.068143* |
-17.99226* |
With cointegration confirmed, we estimate the long-run equation using three alternative estimators: Fully Modified OLS (FMOLS), Dynamic OLS (DOLS), and Canonical Cointegrating Regression (CCR). Table 5 (below) reports the resulting coefficient estimates for the cointegrating vector, where LBTC is the dependent variable and LTNF the independent variable (in log-log form). Strikingly, all three estimation methods yield highly congruent results. The estimated long-run elasticity of Bitcoin price with respect to ETF assets is about 1.3 across all techniques. For instance, the FMOLS estimator produces a coefficient of approximately 1.32 on LTNF. This implies that, ceteris paribus, a 1% increase in the total net assets of spot Bitcoin ETFs is associated with roughly a 1.32% increase in the market price of Bitcoin (LBTC) in the long run. The DOLS and CCR estimates are of a similar magnitude (on the order of 1.28–1.35) and all three coefficients are statistically significant (typically at the 5% level or better). The fact that FMOLS, DOLS, and CCR—despite their different approaches to handling endogeneity and serial correlation—all converge on nearly the same elasticity provides reassurance that the cointegrating relationship is robust. In practical terms, our results indicate a strong positive long-run association between the size of Bitcoin ETF holdings (as measured by their total net assets) and the price of Bitcoin itself.
The economic interpretation of these findings is that growth in ETF assets under management (AUM) goes hand-in-hand with higher equilibrium prices for Bitcoin. The estimated elasticity slightly above 1 suggests a more-than-proportional effect: a surge in ETF AUM tends to be accompanied by an even larger percentage increase in Bitcoin’s price. This positive long-run relationship can be explained through several plausible mechanisms:
• Direct Demand Channel: Spot Bitcoin ETFs create a direct link between investor fund flows and the underlying Bitcoin demand. When new shares of a spot ETF are created (due to investor inflows), the ETF provider or its authorized participants must purchase the corresponding amount of Bitcoin to hold in custody. This process translates incoming investment capital into immediate buying pressure on the Bitcoin spot market, driving the price upward. In essence, as ETF total assets grow, it reflects net new Bitcoin purchases by the funds, which naturally push the equilibrium price higher.
• Investor Sentiment and Signaling: Increases in Bitcoin ETF AUM may also serve as a bullish signal to the broader market. Rapid growth in ETF holdings suggests rising institutional and retail acceptance of Bitcoin through regulated vehicles. This can enhance market sentiment, as a swelling ETF indicates confidence and mainstream interest in the asset. Such signaling could induce additional demand beyond the ETF itself, as other investors interpret AUM growth as an endorsement of Bitcoin’s prospects (and perhaps a harbinger of further price appreciation). In this way, higher LTNF can bolster investor optimism, reinforcing positive price dynamics.
• Liquidity and Market Depth: The expansion of Bitcoin ETFs could gradually improve market liquidity and depth, which may support higher prices with lower volatility. As ETF participation increases, the Bitcoin market benefits from broader investor participation and more channels of capital inflow. Although spot ETF trading volumes still represent a modest fraction of total Bitcoin trading activity, the presence of large ETFs provides an additional mechanism for price discovery and arbitrage. Over time, this institutional involvement might reduce market frictions and risk premia, contributing to a higher equilibrium price for a given level of demand. In short, a growing ETF sector potentially enhances the overall market infrastructure and accessibility of Bitcoin, which can have a positive influence on price in the long run.
Table 5. Cointegration test results: Fully modified ordinary least squares, dynamic ordinary least squares, and canonical cointegrating regression. |
|
Variable |
Coefficient |
Std. Error |
t-Statistic |
Prob. |
| Panel A: Results from FMOLS | ||||
|
LTNF |
1.322802 |
0.062920 |
21.02362 |
0.0000*** |
|
C |
-3.634680 |
0.704165 |
-5.161690 |
0.0000*** |
| Panel B: Results from DOLS | ||||
|
LTNF |
1.269395 |
0.060330 |
21.04078 |
0.0000*** |
|
C |
-3.055940 |
0.677759 |
-4.508886 |
0.0000*** |
| Panel C: Results from CCR | ||||
|
LTNF |
1.320833 |
0.062591 |
21.10266 |
0.0000*** |
|
C |
-3.612592 |
0.700284 |
-5.158756 |
0.0000*** |
| Note: *** denotes significance level of 1%. | ||||
A crucial consideration in interpreting these results is the direction of causality between LTNF and LBTC. Our cointegration setup treats LTNF (ETF assets) as the long-run exogenous driver and LBTC (Bitcoin price) as the dependent variable. The rationale for this direction is grounded in economic intuition: expansions in ETF AUM primarily reflect new investment inflows into Bitcoin (as discussed above), which should cause upward pressure on price, whereas the reverse effect—Bitcoin’s price rise causing an increase in ETF AUM—is more indirect. Indeed, an increase in Bitcoin’s price will mechanically increase the dollar value of a given quantity of ETF-held BTC (thus raising LTNF even without new inflows), and sharp price rallies can attract additional ETF purchases from momentum-driven investors. 43 We acknowledge that such feedback effects mean the causality can be bidirectional to some extent (with positive price trends spurring ETF inflows, which in turn further boost price). However, from a long-run perspective it is reasonable to argue that persistent growth in ETF holdings (through net inflows) drives price rather than the other way around. This view is supported by empirical evidence that changes in ETF flows contain predictive information for subsequent Bitcoin price movements.44 In other words, periods of rising ETF investment have been found to Granger-cause increases in Bitcoin prices, consistent with a causal interpretation where capital inflows lead the market upward. Therefore, while recognizing the potential for two-way interaction, we interpret our results as indicative that the proliferation and expansion of spot Bitcoin ETFs have been a facilitating force for Bitcoin’s price appreciation, anchoring a long-run equilibrium relationship between the two.
Despite the robust long-run coefficient estimates, it is important to consider alternative interpretations and limitations of our analysis. First, the statistical evidence of cointegration, although present, is not overwhelmingly strong—the tests reject no-cointegration only at the 10% level. This marginal significance could be a consequence of the limited sample period. Our data cover just the initial phase of spot Bitcoin ETF adoption (roughly a year or so); with such a short span, structural breaks or idiosyncratic events might distort the tests, and there may simply not yet be enough variation to firmly establish long-run patterns. Second, our model is deliberately simple and bivariate, focusing only on Bitcoin price and ETF assets. This parsimonious approach leaves out other variables (macro-financial indicators, broader crypto market trends, etc.) that could influence both Bitcoin demand and ETF growth. Omission of relevant factors might bias the results or overstate the apparent connection between LBTC and LTNF if, for example, a third factor (like overall market sentiment) drives both. Third, there is a degree of endogeneity in the construction of LTNF: because LTNF is the dollar value of ETF holdings, it inherently moves with Bitcoin’s price as well as with net share issuance. This means part of the contemporaneous correlation between LTNF and LBTC is mechanical (when BTC price doubles, LTNF doubles, absent outflows). While our cointegration approach attempts to capture a stable proportional relationship (and the nearly unitary elasticity ~1.3 suggests LTNF grows slightly faster than price on average, presumably due to net inflows), caution is warranted in attributing the relationship entirely to causal flow-driven dynamics.
Notwithstanding these caveats, the empirical results point to a substantively important linkage between the growth of Bitcoin ETF assets and Bitcoin’s market value. The consistency of the estimated elasticity across multiple methods, combined with economic reasoning, supports the view that the advent of spot Bitcoin ETFs has forged a new channel connecting traditional investment flows with cryptocurrency prices. In sum, our findings provide preliminary evidence of a cointegrating equilibrium wherein increased institutional adoption (via ETFs) and Bitcoin price appreciation go hand-in-hand. This offers insight into how financial innovation in the crypto space can impact asset pricing, and it lays a groundwork for future research to further explore the long-run interplay between Bitcoin and the vehicles that facilitate its investment.
Our analysis confirms a robust long-term linkage between Bitcoin spot ETF holdings and the price of Bitcoin. In practical terms, the cointegrated relationship implies that increases in ETF assets under management are systematically accompanied by increases in Bitcoin’s price over time, reflecting a stable equilibrium condition. This result suggests that the introduction and growth of Bitcoin ETFs have structurally integrated with the Bitcoin market, lending empirical credence to the view that ETF-driven capital flows can elevate the underlying asset’s valuation. The evidence aligns with observations from traditional markets that large ETF flows can propagate through to underlying asset prices, and it contributes to the nascent literature on Bitcoin’s integration with mainstream financial markets.15, 29, 12 Notably, cointegration was detected at a 10% significance level—a less stringent threshold than the conventional 5%—indicating moderately strong (but still significant) evidence of a long-run equilibrium. This nuance underscores that while the link is evident, further data and longer sample periods will help solidify its statistical certainty. These findings carry important implications for both research and practice. For academic researchers, our results open new avenues to explore how financial innovation affects market efficiency and price formation in cryptocurrency markets. Institutional investors and portfolio managers can glean that ETF inflows are not benign; rather, such flows may influence the underlying Bitcoin market’s trajectory, which is crucial for risk management and strategic asset allocation. Regulators and policymakers should likewise note that permitting popular investment vehicles like Bitcoin ETFs could have nontrivial effects on market dynamics.12 In essence, the cointegrated relationship observed here implies that Bitcoin ETFs are not merely passive mirrors of the market but active participants in price discovery.
This study is among the first to empirically document a long-run equilibrium between Bitcoin ETF asset growth and Bitcoin prices—a novel finding made possible by the recent debut of spot Bitcoin ETFs. Given the nascent nature of this research area, several paths for future inquiry emerge. First, modeling the short-run dynamics via error-correction models or high-frequency analysis would be valuable to understand the speed and nature of adjustments when ETF flows and prices deviate from equilibrium. Second, deeper analysis of investor behavior within Bitcoin ETFs (for example, dissecting retail vs. institutional participation or sentiment-driven trading patterns) could clarify the mechanisms by which ETF demand transmits to the spot market. Third, incorporating macroeconomic drivers (such as interest rates, equity market trends, or global liquidity conditions) into the cointegration framework may help control for external factors and verify that the observed relationship is truly driven by the ETF channel. Finally, as more data become available, testing the stability and robustness of the cointegrating relationship in the post-2025 period will be crucial, especially after major market events or additional ETF launches. Such extensions will refine our understanding of the ETF–Bitcoin nexus and its implications for the evolving cryptocurrency ecosystem.
The authors declare that they have no known conflicts of interest as per the journal’s Conflict of Interest Policy.
1 Monaghan, A. “Bitcoin ‘Biggest Bubble in History,’ Says Economist Who Predicted 2008 Crash.” The Guardian (2 February 2018) https://www.theguardian.com/technology/2018/feb/02/bitcoin-biggest-bubble-in-history-says-economist-who-predicted-2008-crash.
2 Nambiampurath, R. “BlackRock’s Bitcoin ETF: How It Works, Its Benefits and Opportunities.” Cointelegraph (27 June 2023) https://cointelegraph.com/learn/articles/blackrocks-bitcoin-etf.
3 Greifeld, K. “Grayscale’s GBTC Bitcoin ETF Exodus Reaches $7.4 Billion in 30 Days.” Bloomberg (26 February 2024) https://www.bloomberg.com/news/articles/2024-02-26/grayscale-s-gbtc-bitcoin-etf-exodus-reaches-7-4-billion-in-30-days.
4 Hu, Y., Hou, Y., Oxley, L. “Spot and Futures Prices of Bitcoin: Causality, Cointegration and Price Discovery from a Time-Varying Perspective.” University of Waikato Working Paper in Economics 19/13 (accessed 10 December 2025) https://ideas.repec.org/p/wai/econwp/19-13.html.
5 Kolostyak, S. “SEC Approves Spot Bitcoin ETFs for Trading in ‘Watershed’ Move.” Morningstar (11 January 2024) https://global.morningstar.com/en-gb/markets/sec-approves-spot-bitcoin-etfs-for-trading-in-watershed-move.
6 Gensler, G. “Statement on the Approval of Spot Bitcoin Exchange-Traded Products.” U.S. Securities and Exchange Commission (10 January 2024) https://www.sec.gov/newsroom/speeches-statements/gensler-statement-spot-bitcoin-011023.
7 Morrison Foerster. “Don't Get Too Excited, but the SEC Approved Bitcoin ETPs.” MoFo Insights (1 February 2024) https://www.mofo.com/resources/insights/240201-dont-get-too-excited-but-the-sec-approved-bitcoin-etps.
8 Todorov, K. “Launch of the First US Bitcoin ETF: Mechanics, Impact, and Risks.” BIS Quarterly Review (December 2021) https://www.bis.org/publ/qtrpdf/r_qt2112t.htm.
9 No Author. “Bitcoin ETF trades top US$4.6 billion in ‘ground-breaking’ day.” The Business Times (12 January 2024) https://www.businesstimes.com.sg/companies-markets/banking-finance/bitcoin-etf-trades-top-us46-billion-ground-breaking-day.
10 Davis, K. “How Spot Bitcoin ETFs Are Performing Across Exchanges.” Cboe Global Markets (13 March 2024) https://www.cboe.com/insights/posts/how-spot-bitcoin-et-fs-are-performing-across-exchanges.
11 Rosen, P. “Bitcoin ETFs Were a ‘Sell the News’ Event After All.” Markets Insider (23 January 2024) https://markets.businessinsider.com/news/currencies/bitcoin-price-spot-etf-investors-sec-financial-markets-cryptocurrency-regulators-2024-1.
12 Babalos, V., Bouri, E., Gupta, R. “Does the Introduction of US Spot Bitcoin ETFs Affect Spot Returns and Volatility of Major Cryptocurrencies?” The Quarterly Review of Economics and Finance 102 102006 (2025) https://doi.org/10.1016/j.qref.2025.102006.
13 Purpose Investments, Inc. “Purpose Investments Marks One-Year Anniversary of World’s First Bitcoin ETF.” Yahoo Finance (18 February 2022) https://finance.yahoo.com/news/purpose-investments-marks-one-anniversary-123000669.html.
14 Zou, Y. “Lost in the Rising Tide: ETF Flows and Valuation.” UCLA Anderson School of Management (accessed 11 December 2025) https://api.semanticscholar.org/CorpusID:141021659.
15 Ben-David, I., Franzoni, F., Moussawi, R. “Do ETFs Increase Volatility?” The Journal of Finance 74.4 (2019)https://doi.org/10.1111/jofi.12640.
16 State Street Global Advisors. “SPDR ETFs: Liquidity and Price Discovery Tools.” ETF Db (accessed 13 December 2025) https://etfdb.com/esg-content-hub/spdr-etfs-liquidity-and-price-discovery-tools/.
17 Gemayel, R., Franus, T., Bowden, J. “Price Discovery Between Bitcoin Spot Markets and Exchange-Traded Products.” Economics Letters 228 111152 (2023) https://doi.org/10.1016/j.econlet.2023.111152.
18 Ivanov, S. I. “The Influence of ETFs on the Price Discovery of Gold, Silver and Oil.” Journal of Economics and Finance 37.4 453–462 (2013) https://doi.org/10.1007/s12197-011-9205-8.
19 Staer, A. “Fund Flows and Underlying Returns: The Case of ETFs.” International Journal of Business 22.4 276–304 (2017) https://ijb.cyut.edu.tw/var/file/10/1010/img/863/V224-1.pdf.
20 Conlon, T., Corbet, S., McGee, R. J. “Inflation and Cryptocurrencies Revisited: A Time-Scale Analysis.” Economics Letters 206 109996 (2021) https://doi.org/10.1016/j.econlet.2021.109996.
21 Kumar, A. S., Padakandla, S. R. “Testing the Safe-Haven Properties of Gold and Bitcoin in the Backdrop of COVID-19: A Wavelet Quantile Correlation Approach.” Finance Research Letters 47.B 102707 (2022) https://doi.org/10.1016/j.frl.2022.102707.
22 KBouri, E., Molnár, P., Azzi, G., Roubaud, D., Hagfors, L. I. “On the Hedge and Safe Haven Properties of Bitcoin: Is It Really More than a Diversifier?” Finance Research Letters 20 192–198 (2017) https://doi.org/10.1016/j.frl.2016.09.025.
23 Hughen, W. K., Gorman, M. “Does Bitcoin Still Enhance an Investment Portfolio in a Post-Covid World?” Finance Research Letters 62.B 105170 (2024) https://doi.org/10.1016/j.frl.2024.105170.
24 Gannatti, C. “Bitcoin Correlations with Asset Classes.” WisdomTree (2021) https://www.wisdomtree.com/investments/-/media/us-media-files/documents/resource-library/market-insights/gannatti-commentary/bitcoin-correlations.pdf.
25 Chibane, M., Janson, N. “Is Bitcoin the Best Safe Haven Against Geopolitical Risk?” Finance Research Letters 74 106543 (2025) https://doi.org/10.1016/j.frl.2024.106543.
26 Smales, L. A. “Cryptocurrency as an Alternative Inflation Hedge?” Accounting & Finance 64.2 1589–1611 (2024) https://doi.org/10.1111/acfi.13193.
27 Baur, D. G., Lucey, B. M. “Is Gold a Hedge or a Safe Haven? An Analysis of Stocks, Bonds and Gold.” The Financial Review 45.2 217–229 (2010) https://doi.org/10.1111/j.1540-6288.2010.00244.x.
28 Sabban, A., Giles, M. “Investors Favor Gold Over Bitcoin ETFs During Recent Market Volatility.” Morningstar (20 March 2025) https://www.morningstar.com/funds/investors-favor-gold-over-bitcoin-etfs-during-recent-market-volatility.
29 Ahmadova, A., Guliyev, T., Aliyev, K. “The Relationship Between Bitcoin and Nasdaq, U.S. Dollar Index and Commodities.” International Journal of Energy Economics and Policy 14.1 281–289 (2024) https://doi.org/10.32479/ijeep.14996.
30 Phillips, P. C. B., Hansen, B. E. “Statistical Inference in Instrumental Variables Regression with I(1) Processes.” Review of Economic Studies 57.1 99–125 (1990) https://doi.org/10.2307/2297545.
31 Stock, J. H., Watson, M. W. “A Simple Estimator of Cointegrating Vectors in Higher Order Integrated Systems.” Econometrica 61.4 783–820 (1993) https://doi.org/10.2307/2951763.
32 Park, J. Y. “Canonical Cointegrating Regressions.” Econometrica 60.1 119–143 (1992) https://doi.org/10.2307/2951679.
33 Özer, M., Frömmel, M., Kamişli, M., Vuković, D. B. “Do Bitcoin Shocks Truly Cointegrate with Financial and Commodity Markets?” International Review of Financial Analysis 95.A 103354 (2024) https://doi.org/10.1016/j.irfa.2024.103354.
34 Miśkiewicz, R., Matan, K., Karnowski, J. “The Role of Crypto Trading in the Economy, Renewable Energy Consumption and Ecological Degradation.” Energies 15.10 3805 (2022) https://doi.org/10.3390/en15103805.
35 Akbulaev, N., Abdulhasanov, T. “Analyzing the Connection Between Energy Prices and Cryptocurrency Throughout the Pandemic Period.” International Journal of Energy Economics and Policy 13.1 227–234 (2023) https://ssrn.com/abstract=4428120.
36 Phillips, P. C. B. “Fully Modified Least Squares and Vector Autoregression.” Econometrica 63.5 1023–1078 (1995) https://doi.org/10.2307/2171721.
37 Alimi, R. S. “ARDL Bounds Testing Approach to Cointegration: A Re-Examination of Augmented Fisher Hypothesis in an Open Economy.” Asian Journal of Economic Modelling 2.2 103–114 (2014) https://doi.org/10.18488/journal.8.2014.22.103.114.
38 Dickey, D. A., Fuller, W. A. “Distribution of the Estimators for Autoregressive Time Series with a Unit Root.” Journal of the American Statistical Association 74.366 427–431 (1979) https://doi.org/10.2307/2286348.
39 Phillips, P. C. B., Perron, P. “Testing for a Unit Root in Time Series Regression.” Biometrika 75.2 335–346 (1988) https://doi.org/10.1093/biomet/75.2.335.
40 Engle, R. F., Granger, C. W. J. “Co-Integration and Error Correction: Representation, Estimation, and Testing.” Econometrica 55.2 251–276 (1987) https://doi.org/10.2307/1913236.
41 Phillips, P. C. B., Ouliaris, S. “Asymptotic Properties of Residual Based Tests for Cointegration.” Econometrica 58.1 165–193 (1990) https://doi.org/10.2307/2938339.
42 Kia, K., Liu, B., Li, Q., Song, V., Xu, K. “Price Discovery in Bitcoin ETF Market.” The Financial Review 1-15 (2025) https://doi.org/10.1111/fire.70026.
43 coinfomania. “A Sharp Shift in Crypto ETF Flows Creates New Market Momentum.” Bitget (24 November 2025) https://www.bitget.com/news/detail/12560605079477.
44 Lawant, D., “What Can Spot ETF Flows Tell Us About the Trajectory of Bitcoin Prices? A Preliminary Statistical Investigation.” FalconX (11 October 2024) https://www.falconx.io/newsroom/what-can-spot-etf-flows-tell-us-about-the-trajectory-of-bitcoin-prices-a-preliminary-statistical-investigation.
